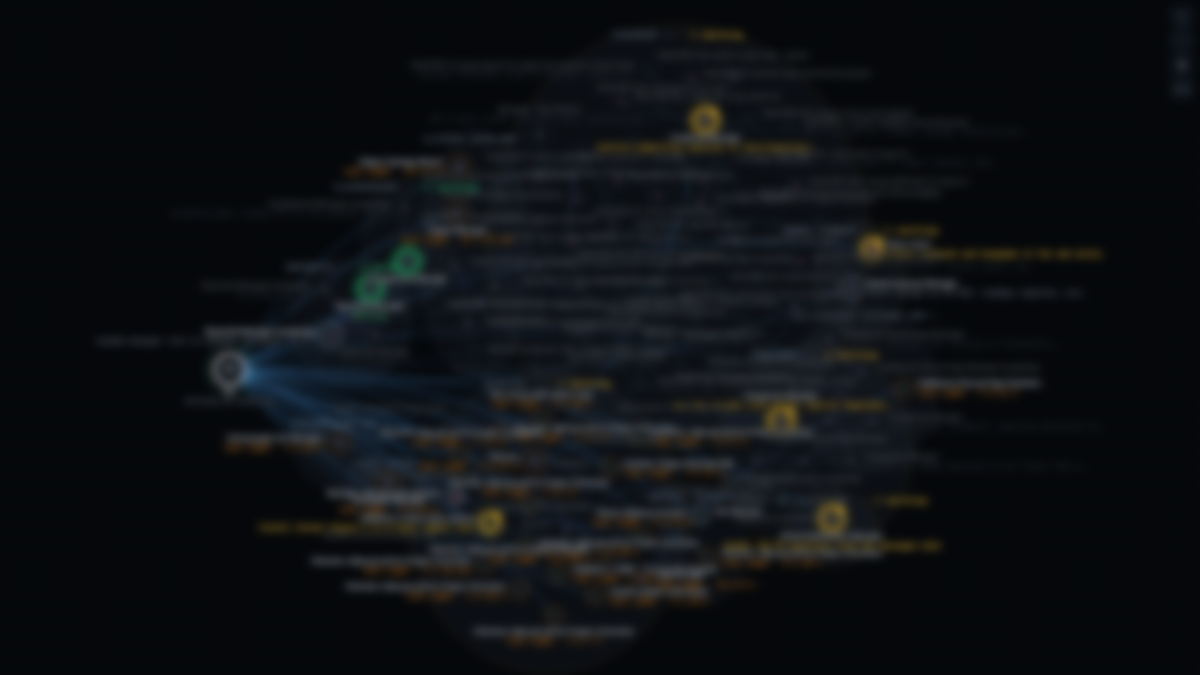
Claudeboard is a dashboard that draws every Claude Code session on the owner's machine, local, cloud, persistent peers, and subagents, as a live force graph with the messages, spawns, and tool calls flowing between them. There was no pain to fix. The owner saw someone else's live session graph and wanted one of their own, and the plan written on 13 October says so in their words: it is being designed for the love of seeing it work. It still has four questions to answer at a glance: which session is waiting on the owner, who is talking to whom, how fast the usage windows are filling, and what happened while they were away.
Everything it reads is already on the machine, in the desktop app's session store, the command-line tool's process files, and the transcripts, so version one is a local page served from the box, with a narrow layout for the phone. One rule from day one: content never leaves the machine. Anything that reaches another device is metadata only.
Slice one was built as two halves on 14 October and ran against the real machine the same night: every session drawn, every live one matching the app's own sidebar, without any session reporting itself. The remaining five slices took one more day: flows on the edges, the chrome to spec, an observer session, three layouts, a tray icon, and a phone layout. Version one was code-complete on 15 October. The same day, under an order to keep going without the owner, replay of any past day, a searchable history of sessions, and a retention setting were merged, and the 1.0.0 release was prepared with a changelog, an install guide, and a release workflow. The release tag waits for the owner. On the night of 18 to 19 October, still without the owner, ten more pull requests landed: the board now draws which manager directs which sessions, labels never overlap, and every file source tells a locked file from a broken one.